 |
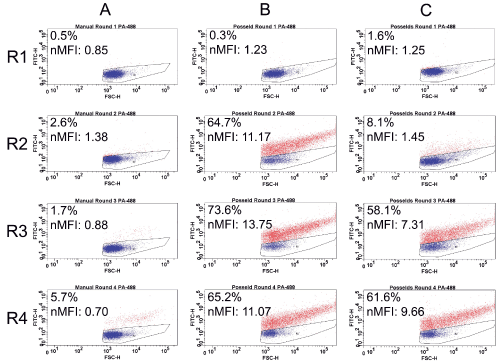
| Figure 1: FACS analysis of sorting rounds for discovery of peptide candidates to protective antigen (PA). FITC-H vs. FSC-H of cells bound to 250 nM PA488 for rounds 1-4 (R1-R4) of (A) manual MACS sorting, (B) autoMACS® Pro Separator Program D sorting, or (C) autoMACS® Pro Separator Program DS sorting of a bacterial peptide display library. The percentage of cells falling outside of the P2 gate is shown in red and in the top left corner of each box. The Normalized Median Fluorescence Intensity (nMFI) of the entire population is also shown. |