|
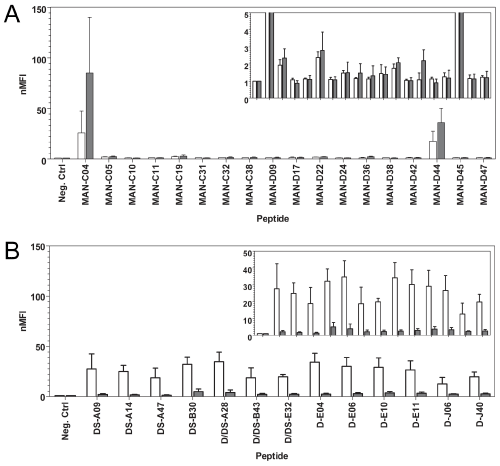
| Figure 2: Normalized Median Fluorescence Intensity (nMFI) of potential PA binders. (A) Manual round 4 on-cell peptides analyzed by FACS. Inlet shows the graph with maximum nMFI of 5 to highlight the consistency between the PA488 and SAPE signal throughout. (B) Miltenyi autoMACS® round 4 top candidates among repeating sequences, chosen for high PA488:SAPE by FACS. Inlet shows the graph with maximum nMFI of 50 to highlight that the magnitude of the PA488 signal is 10-fold higher than most manual candidates, and the SAPE binding is low. |