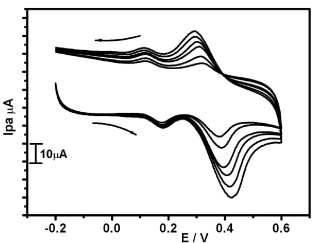
Figure 4a:
Cyclic voltammograms of at Paracetamol different concentration at Poly (glycine) MCPE in 0.2M PBS of pH 7.0.