 |
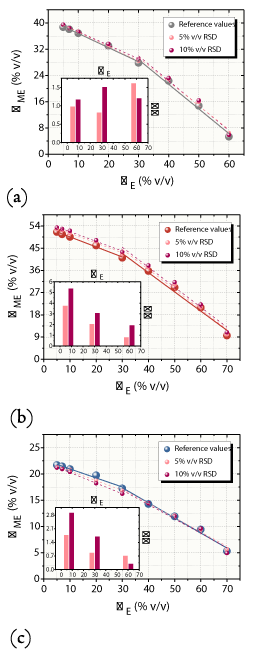
| Figure 4: Analytical curves in A (a), B (b), and C (c) regions for ethanol standards in W phase with deviations in ΦO utilizing water-n-propanololeic acid MEs at 23°C. Inset: values of ΔΦ as a function of ΦE for 7.00%, 30.00%, and 60.00% v/v ΦE taking up 5.00% and 10.00% v/v RSD in ΦO. All of the R2 values were larger than 0.99. Analytical sensitivities were: -0.44/-0.73 (5.00%) and -0.41/-0.76 (10.00%) in A; -0.40/-0.81 (5.00%) and -0.39/-0.81 (10.00%) in B; and -0.19/-0.27 (5.00%) and -0.20/-0.27 (10.00% v/v RSD) in C. ΔΦ parameter is given in module. |