 |
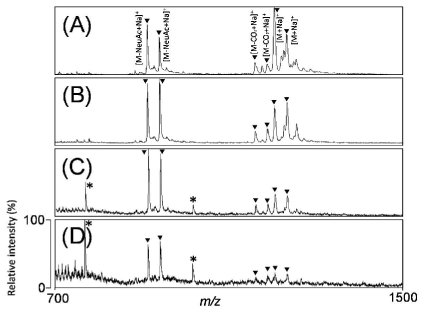
| Figure 2: MALDI-TOF MS spectra of various concentrations of ganglioside GM3 after preparation with DHB. GM3 concentrations - (A) GM3 1 nmol, (B) 100 pmol, (C) 10 pmol, and (D) 1 pmol. ▼ and * indicate sodium adduct ions and background ions, respectively. |