 |
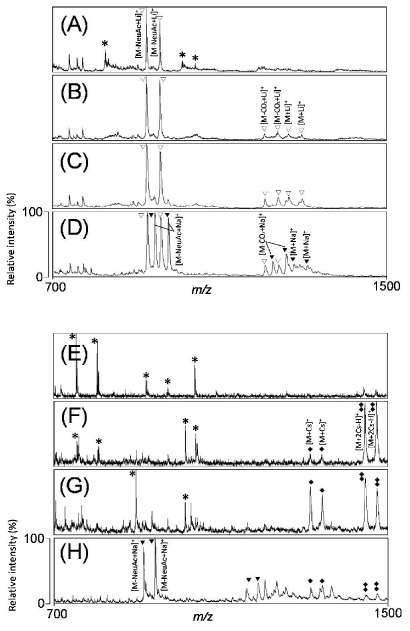
| Figure 3: Effect of alkali metal salt on MALDI-TOF MS pattern of GM3. MALDITOF MS spectra of GM3 (100 pmol) after preparation with DHB and various concentrations of LiCl (A) 400 nmol, (B) 40 nmol, (C) 4 nmol, and (D) 400 pmol. MALDI-TOF MS spectra of GM3 (100 pmol) after preparation with DHB and various concentrations of CsCl (E) 400 nmol, (F) 40 nmol, (G) 4 nmol, and (H) 400 pmol. ▼, ▽, ◆, and * indicate sodium adducts, lithium adducts, cesium adducts, and background ions, respectively. |