 |
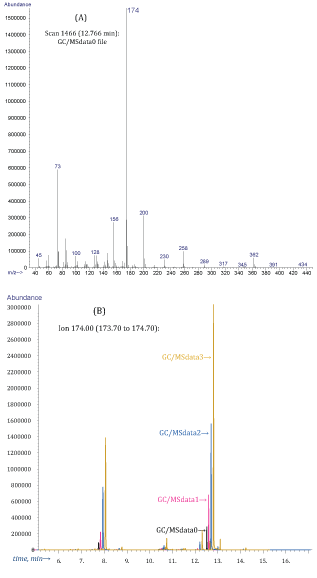
| Figure 5: (A) Mass spectrum extracted at 12.766 min from GC/MS0 file of the main basic experiment. (B) Extracted Ion Chromatograms at 174 Th extracted from GC/MSfile0, GC/MSfile1, GC/MSfile2, GC/MSfile3 showing peaks at a retention time corresponding to the expected retention time of Lysine2TMS methyl ester artifact. Chromatograms are shifted along the time axis for clarity. |