 |
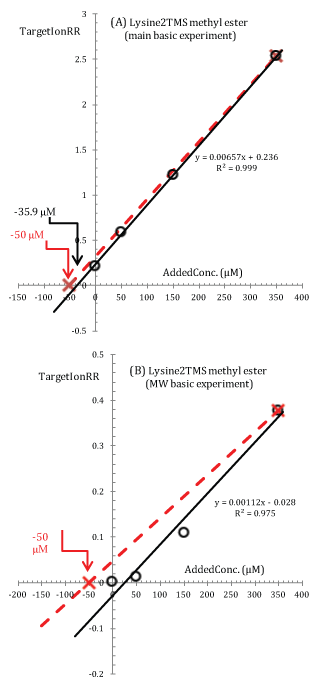
| Figure 6: (A) Modified standard additions plot for Lysine2TMS methyl ester (target ion 174 Th; data from the main basic experiment in Figure 1). Experimental points are interpolated with a least square regression line whose equation is given in the plot (solid line). (B) Same as in (A) but using data from the MW basic experiment. In both cases, the broken lines are drawn through the experimental point at an added concentration of 350 μM and are forced to intercept the abscissa at -50 μM in order to stress inconsistency between points within the calibration curve. |