 |
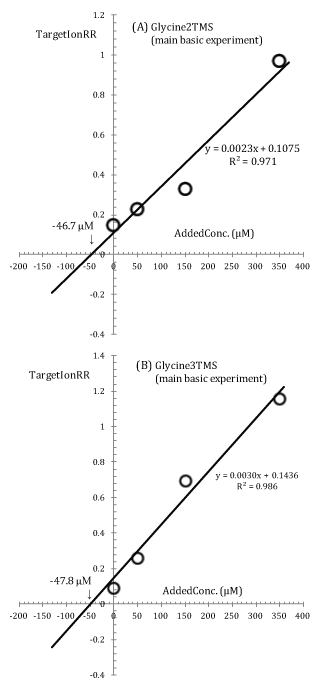
| Figure 9: Modified standard additions plots for Glycine2TMS (target ion 102.10 Th) and Glycine3TMS (target ion 174.15 Th) calculated from data acquired during the main basic experiment. Experimental points are interpolated with a least square regression line whose equation is given in the plot. |