 |
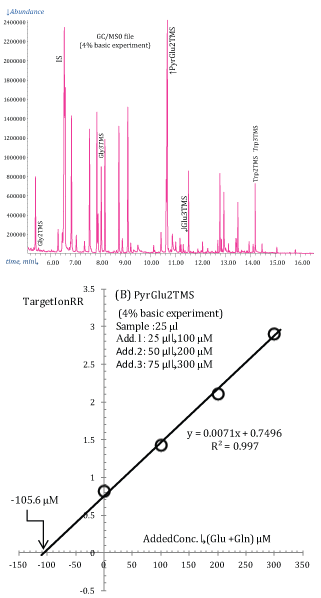
| Figure 12: (A) TIC reconstructed from GC/MSdat0 file of the 4% basic experiment. (B) Modified standard additions plot for PyrGlu2TMS (target ion 156.2 Th) calculated from data collected in the 4% basic experiment. Added concentrations refer to the sum of Glutamine and Glutamic acid concentrations. The expected intercept of regression line on the concentration axis is 200·25/50=100 μM which represents the sum of Glu and Gln concentration in the reaction medium (50 μl). |