 |
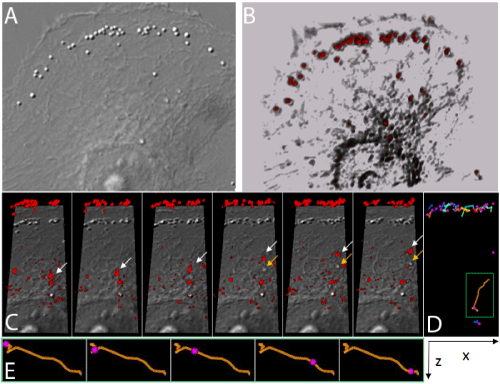
| Figure 4: STA for 4D DIC imaging: representative DIC image of an MDA cell 4D acquisition (A) and associated STA reconstruction (B and supplementary figure 4B) with intensity coded from black to red. C and supplementary figure 4C: mixed representation of high intensity 3D reconstruction (red) with 2D DIC images positioned on the bottom of the volume bounding box (grey). Arrows highlight the displacement of a vesicle in 3D which is visible from the beginning of the experiment in the STA representation (white arrow) and only appears in the 4th time-point on the 2D DIC representation (orange arrow). D represents the result of particle tracking in XY, while (E and supplementary figure 4E) are a zoomed view of YZ particle track. |