 |
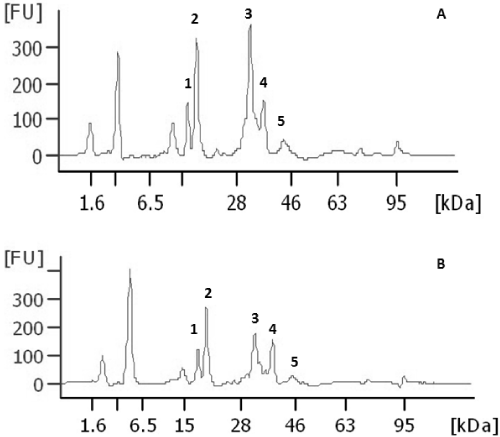
| Figure 1: Electropherograms obtained by Agilent Bioanalysis 2100 of the milk sample added with SEP buffer. Concentrations of SCC; A: milk with 245.000 cells/mL; B: milk with 1.145.000 cells/mL SCC. Identification of peaks: α-lactalbumin (peak 1), β-lactoalbumin (peak 2), β-casein (peak 3), αs-casein (peak 4) and κ-casein (peak 5). |