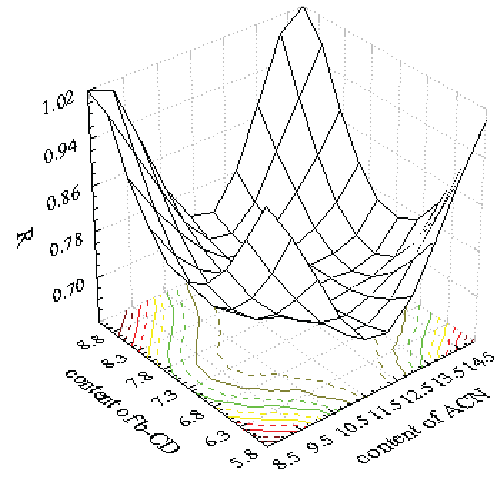
Figure 2:
Three-D graph k
1
=f (% Acetonitrile, content of β–CD) (for Output Y
4
).