 |
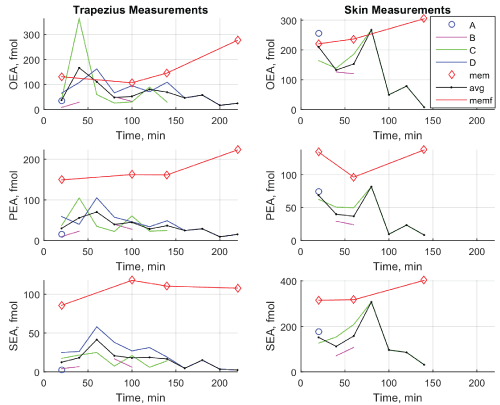
| Figure 1: Microdialysate and catheter membrane levels of OEA, PEA and SEA from trapezius and from skin expressed in fmol. A, B, C and D (D only in trapezius plots) are levels from the microdialysate and ‘mem’ is levels from the catheter membrane, ‘avg’ is the average value of the microdialysate for each point in time, ‘memf’ is the function describing the line between the membrane values. |