 |
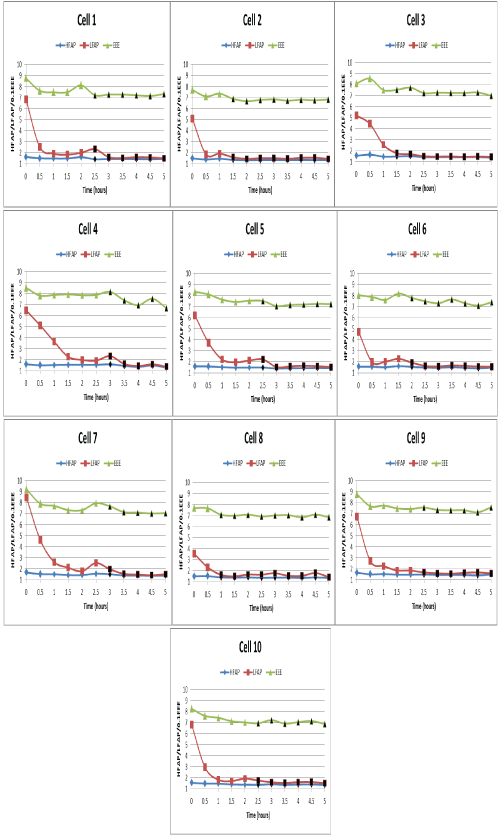
| Figure 4: Serial (0.5 hour interval) HFAP, LFAP and EEE results in ten U-937 dying cells. Blue, red and green curves represent HFAP, LFAP and 0.1EEE values respectively. Abscissa: Time in hours. Ordinate: HFAP, LFAP and 0.1EEE values. Solid black markers on the blue, red and green curves indicate positive PI fluorescence and cell death. |