 |
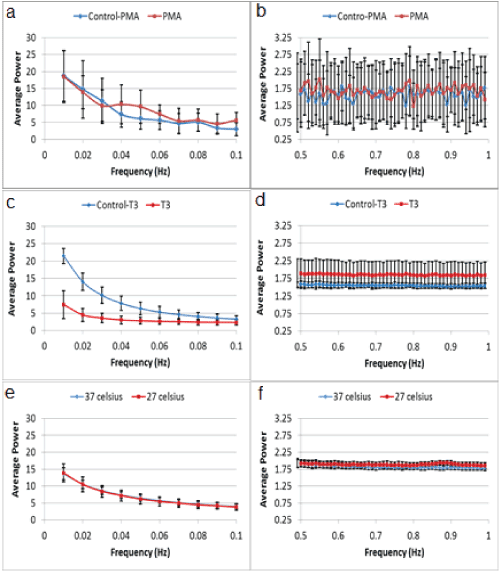
| Figure 6: Average power spectra per frequency obtained in cells pre- and post-application of (a,b) PMA, (c,d) T3 and (e,f) mild hypothermia. For each frequency, the average power of each cell-group was calculated and depicted. To better distinguish deviation between the spectra, data (with complete range of frequencies between 0 and 1 Hz as presented in Figure 2) were divided into two frequency regions: ≤ 0.1 Hz (a,c,e) and >0.5 Hz (column d,f). Black bars depict standard deviation per frequency of power spectra in cell group. |