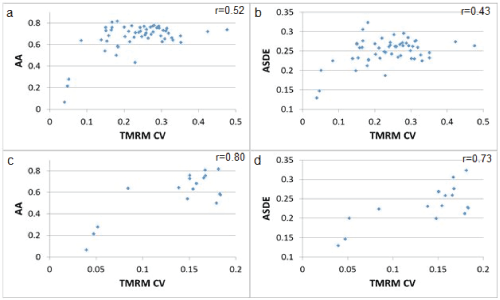
Figure 8:
Correlation between AA (a,c), ASDE (b,d) and TMRM intracellular distribution CV in the complete range of TMRM CV values (a,b) and lower range of TMRM CV values <0.2 (c,d).