 |
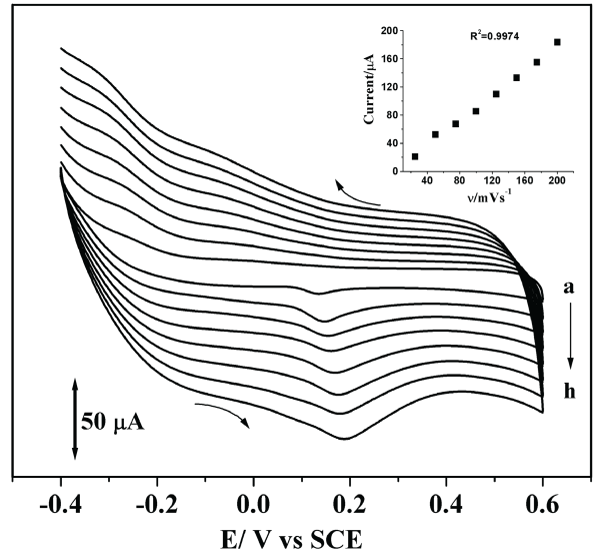
| Figure 4: Cyclic voltammograms of TX-100/CPE in 0.1M phosphate buffer solution (pH 7.0) containing 0.5 × 10⁻⁴M EN at a scan rate of (a) 25, (b) 50, (c) 75, (d) 100, (e) 125, (f) 150, (g) 175, (h) 200 mVs-1. Inset shows the plot of peak currents versus scan rates. |