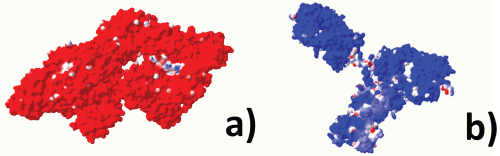
Figure 2:
Electrostatic potential map for a) BSA and b) IgG. Blue regions represent negative charges, while red represent positive.