|
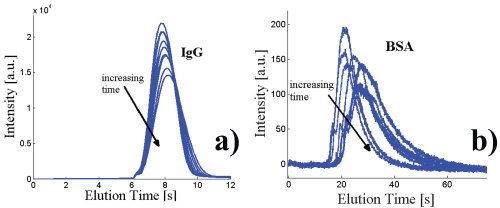
| Figure 6: Electropherogram of IgG-FITC in a PEG coated (20 μm glass cross channel). Intensity (AU) over Elution time as shown. Trials chosen to be representative of the trend. Area under the curve was calculated for each trial and then percent area is displayed in reference to the initial trial (area max). |