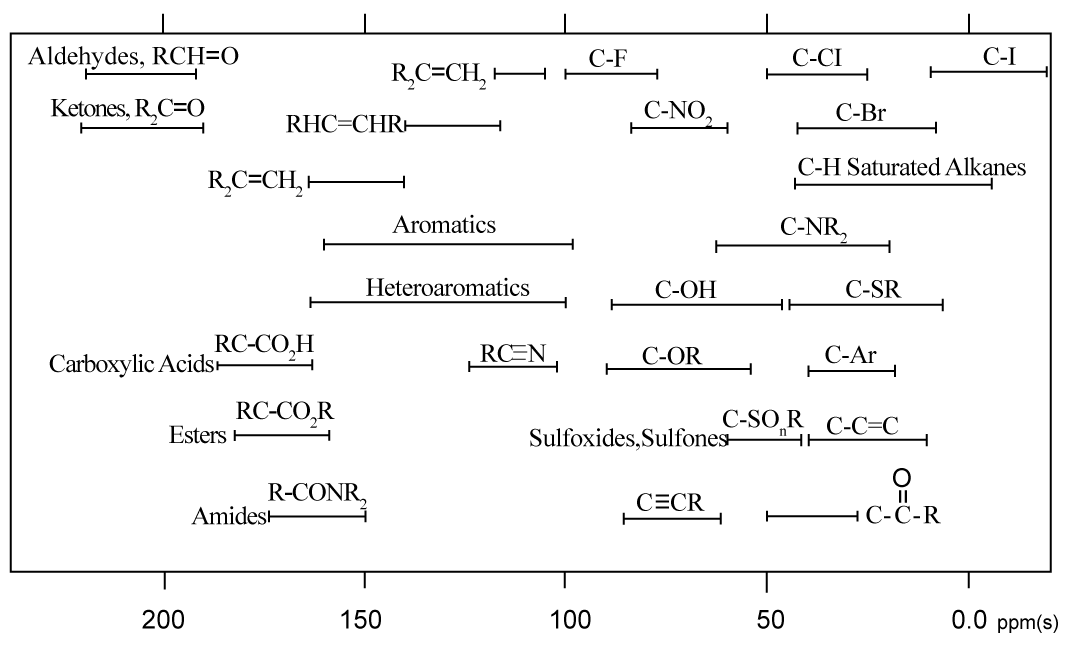
Figure 3:
Chart representing
13
C nuclei chemical shift due to different chemical environments.