 |
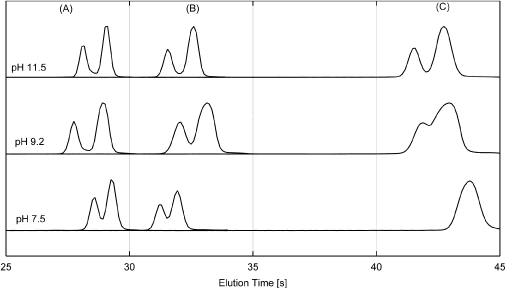
| Figure 5: Electropherograms of E10 and E20 separations at ionic strengths (A) 270 mM (B) 299 mM and (C) 455 mM at pH 11.5 (Top), pH 9.2 (middle) and pH 7.5 (bottom) in sodium phosphate buffer. Detection length varied to match elution times at each ionic strength. |