 |
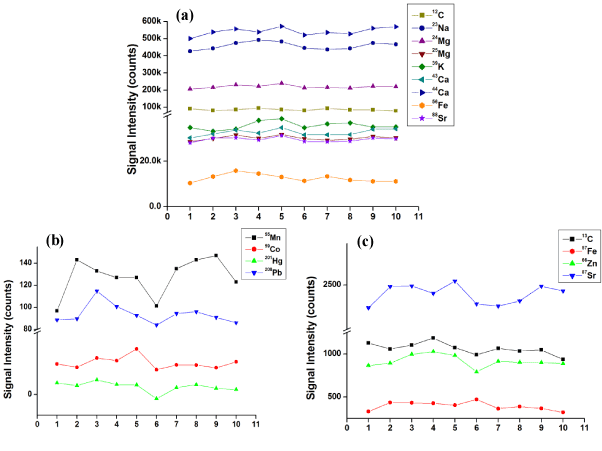
| Figure 2: The average signal intensity of C, Na, Mg, K, Ca, Mn, Fe, Zn, Sr, Hg and Pb from the non-autoclaved bone pellet with 10 replicates (data from only one of the bone pellet are shown here). The counts shown here have been corrected with background counts. These results show a consistent elemental distribution over the course of ten duplicate measurements with low standard deviations. Note: X-axes present the number of replicates. |