 |
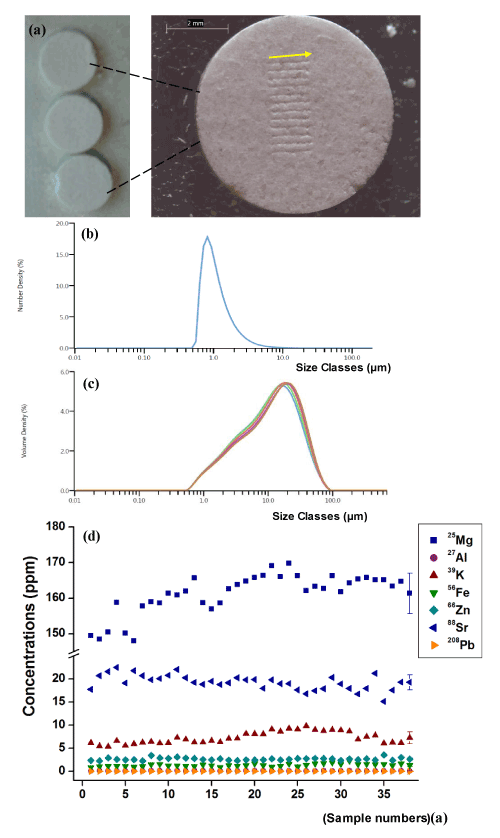
| Figure 3: Homogeneity analysis of non-autoclaved bovine bone pellets. (a) Macroscopic (left panel) and light microscopy (right panel) images. The arrow in the right hand panel indicate the direction of ICP-MS scanning traveling from left to right for a total of twelve duplicate scans for each pellet. (b,c) Particle size distribution analysis data shows a uniform particle size distributions (0.8-100 μm) in the bone pellet (n=5). (d) The concentration plots of 37 replicates from a number of non-autoclaved bone pellets (X-axis represents the number of samples). Sample No. 38 also shows mean ± SD values of the corresponding replicates. |