 , ϕ and the real Z′ and imaginary Z″ parts, respectively
 |
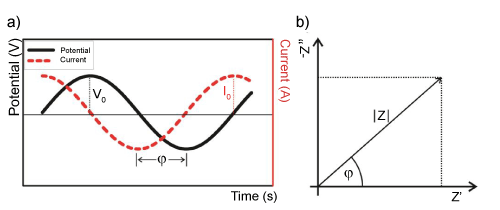
Figure 5: a) Time domain measurements of an impedance analysis at a
single frequency. A sinusoidal voltage perturbation (amplitude V0) and the
sinusoidal current response with amplitude I0 has a phase angle ϕ. (b)
The impedance value associated to the data from (a) can be described as
the modulus  , ϕ and the real Z′ and imaginary Z″ parts, respectively , ϕ and the real Z′ and imaginary Z″ parts, respectively  |