 |
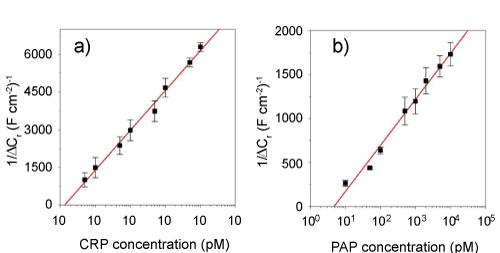
| Figure 14: Analytic capacitive curves reporting Cr for (a) CRP to CRP receptive interfaces and (b) PAP to PAP receptive interfaces. Plotted data points represent means and standard deviations across three measured interfaces in each case. Errors reported at 95% confidence. R2 (for CRP) is 0.994 and R2 (for PAP) is 0.990, where R2 is the coefficient of determination. Reprinted with permission from J. Lehr, F. C. B. Fernandes, P. R. Bueno and J. J. Davis, Analytical Chemistry, 2014, 86, 2559-2564. Copyright (2014) American Chemical Society |