|
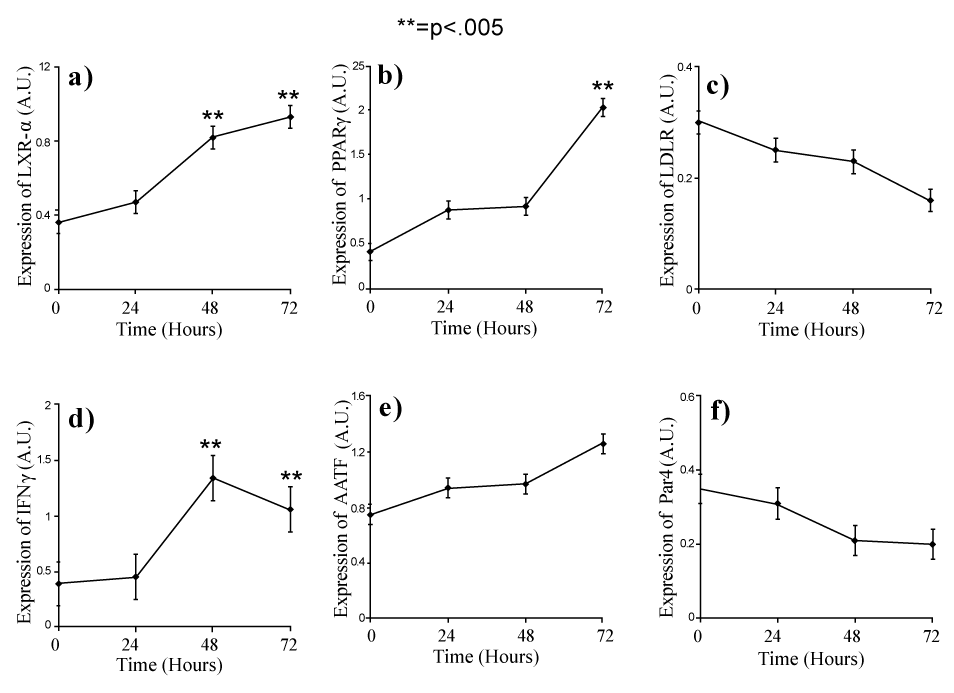
| Figure 2: Time dependent effect of glucose (200mg/dl) and fructose (12µM) on the expression of LXR-α, PPARγ, LDLR, IFNγ, AATF and Par4 in PBMCs derived from normal subjects. Each bar represents mean ± SD for the combined results of three separate experiments. **shows the significance at p value <0.05 with respect to control. |