 |
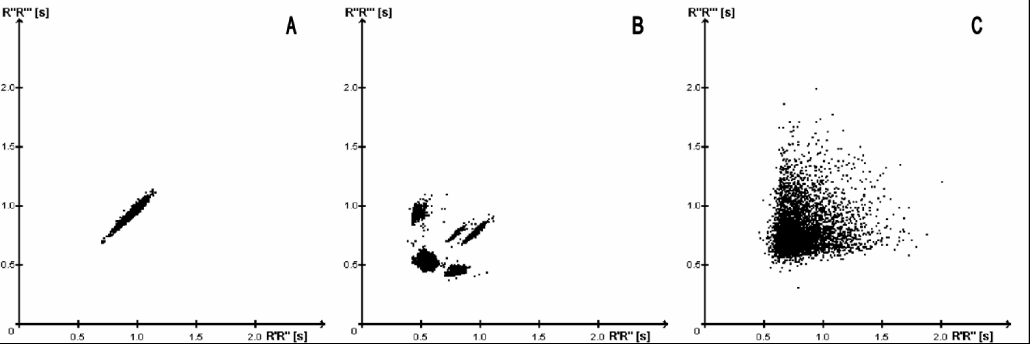
| Figure 1: Examples of Poincaré plots based on one hour ECG recordings. The R-R interval fluctuation is one calculated parameter used to rate the AF risk. The plot in the healthy subject (A) shows a baseball bat like structure. The calculated risk level is 0. The disseminated clusters in a patient with a history of PAF (B) indicate increased R-R interval dynamics (risk level 1). In patients with chronic AF (C) widely scattered R-R intervals indicate a maximum of variability. The calculated level is 2. |