 |
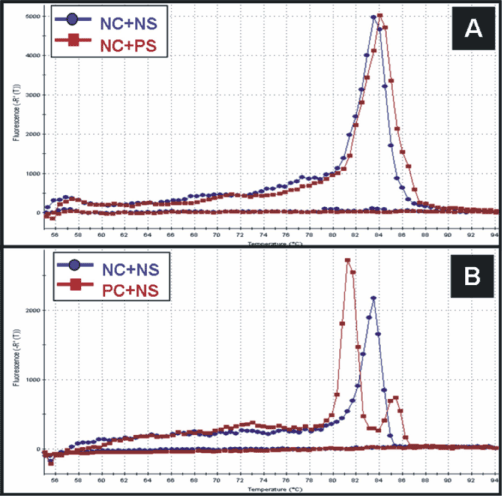
| Figure 4: Amplicon Melting curve analysis of the ligand binding domain of LXR-α gene within: A) Normal cells exposed to patient serum, B) Patient cells exposed to normal serum as compare to that observed in normal cells exposed to Normal serum. X axis shows the temperature in 0C ranging from 50 to 94 where as Y axis shows fluorescence [-Rí(T)]. |