|
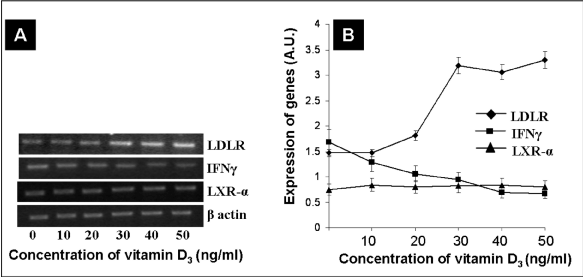
| Figure 6: Dose dependent effect of vitamin D3 on the expression of LXR-α, IFNγ and LDLR in PBMCs derived from CHD patient. A) Representative agarose gel photographs showing ethidium bromide stained RT-PCR products. B) The signal intensities of these RT-PCR products were measured using SCION IMAGE analysis software. The relative levels of target mRNA expression were determined by normalizing their individual band intensity to β actin band intensity. Each bar represents mean ± SD for the combined results of three separate experiments. (Statistical significance is shown by **= p<0.05). |