 |
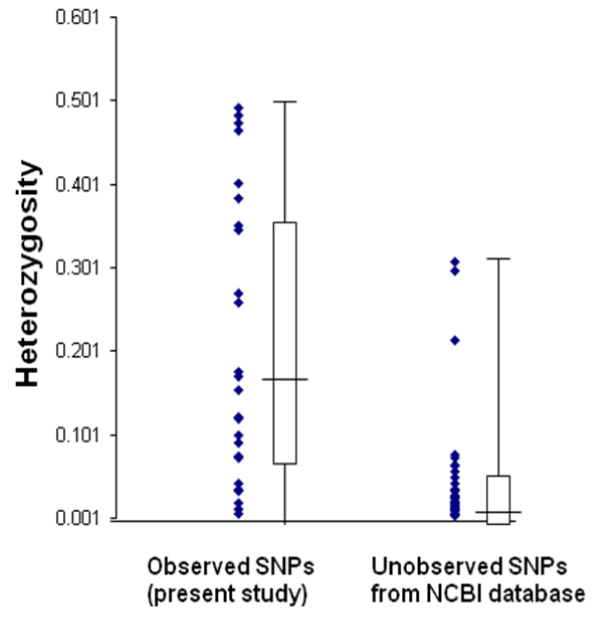
| Figure 1: Distribution of SNP heterogeneity (ratio of the number of observed heterozygous genotypes/total genotypes) for the SNPs discovered in the present study versus SNPs listed in NCBI dbSNP. Shown are range (whiskers) median (horizontal line) and inter-quartile range (box). |