|
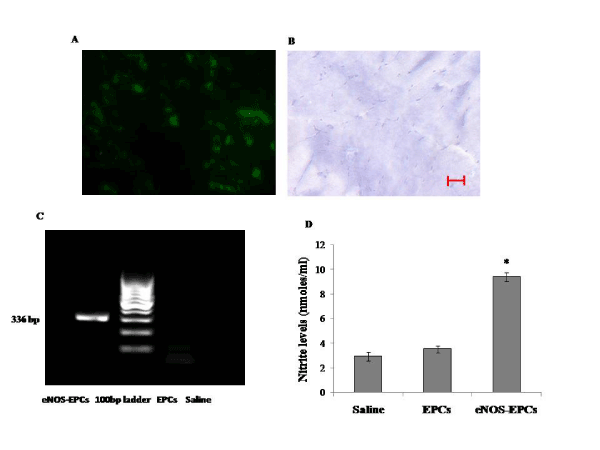
| Figure 2: In vivo expression of eNOS (A) Immunofluorescence detection of human eNOS in frozen sections of ischemic tissues transplanted with eNOSEPCs. (B) Phase contrast picture of hematoxylin stained section from tissues transplanted with eNOS-EPCs. Scale bar represent 30 µm. (C) Representative RT-PCR showing eNOS mRNA expression in the tissue homogenates of eNOSEPC treated animals (n= 5), No expression is observed in EPC treated and PBS treated rabbits (n= 5 each). (D) Nitrite levels (nmoles/ml) in duplicates in tissue homogenates of eNOS-EPCs, EPCs and PBS treated animals. Results are expressed as mean + SD. *P< 0.01 versus EPC treated and PBS treated group. |