|
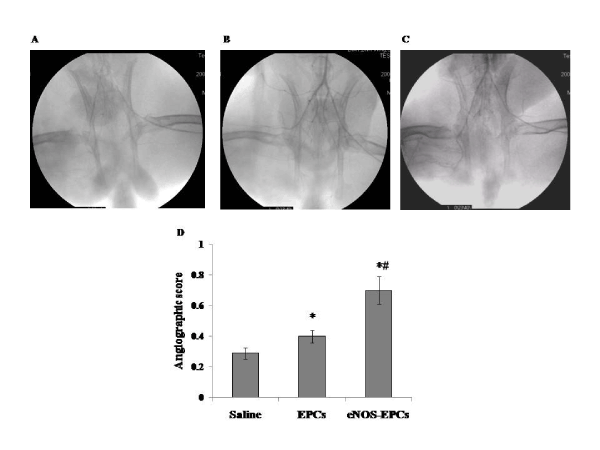
| Figure 4: Selective internal iliac angiograms from animals in (A) PBS treated (B) EPC treated (C) eNOS-EPC treated group. (D) Histogram depicting the number of collateral vessels as quantified by angiographic score in the three groups (n= 5 in each group). Results are expressed as mean + SD. *P< 0.05 versus PBS treated group and #P< 0.05 versus EPC treated group. |