 |
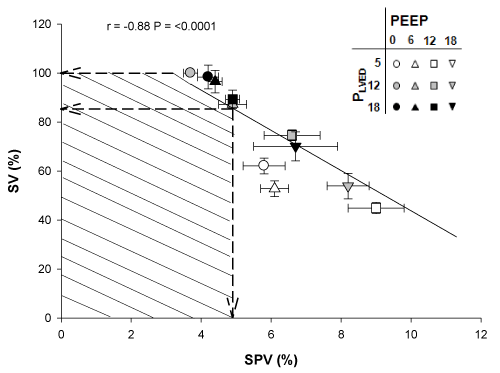
| Figure 1: Figure 1 shows the linear inverse relation between normalized SV and SPV over the range of filling pressures and PEEPs. The normal range of SPV was defined as ≤ 5%. Volume loading decreased SPV and increased SV while increased PEEP decreased SV and increased SPV at each filling pressure. SV was normalized so that the value at PLVED 12 mmHg and PEEP 0 cmH2O was set as 100%. SV, normalized left ventricular stroke volume (%); SPV, systolic pressure variation (%). |