 |
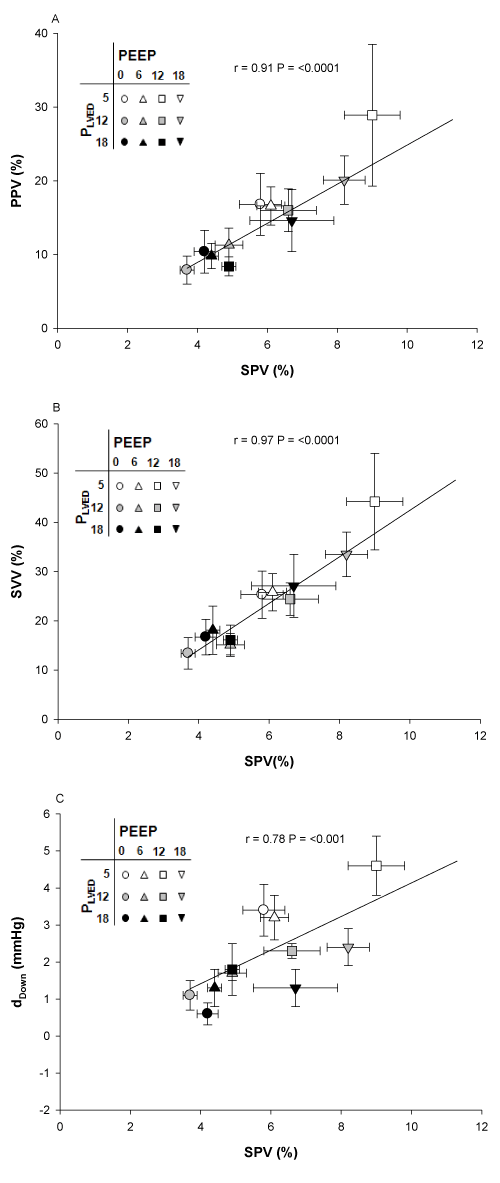
| Figure 6: Figures 6A, 6B and 6C show the relations between PPV and SPV, SVV and SPV and dDown and SPV respectively over the range of filling pressures and PEEPs. Volume loading decreased and PEEP increased PPV, SVV, dDown and SPV. PPV, pulse pressure variation (%); SVV, stroke volume variation (%); dDown, delta down component of aortic systolic pressure (mmHg). |