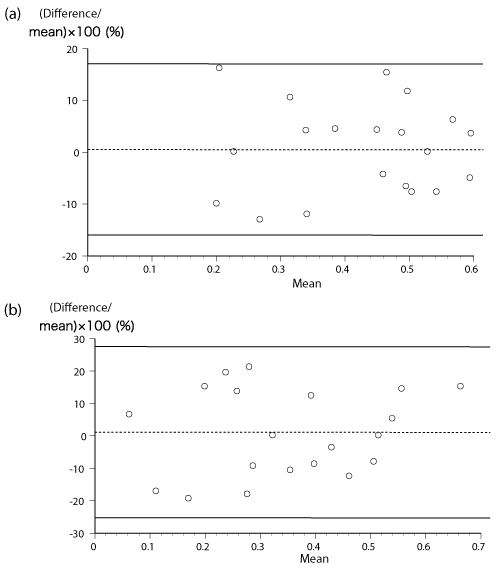
Figure 7:
Bland-Altman plots of intraobserver variability of LV-MPI(a) and RVMPI( b), with the differences between each pair of measurements expressed as a percentage of mean. Mean(broken lines) and 95% limits of agreement(solid lines) are shown.