 |
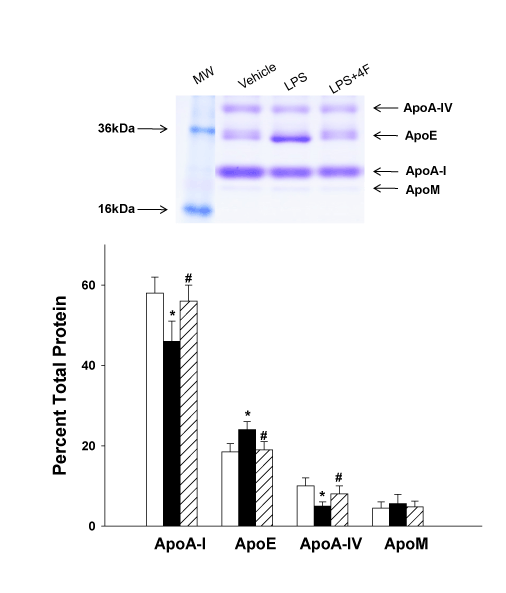
| Figure 4: HDL-associated apolipoproteins are altered by LPS treatment. HDL from control, LPS and LPS+4F rats was isolated by ultracentrifugation. A representative SDS-PAGE gel showing Coomassie blue staining for separated proteins is depicted in the top panel. The identity of bands was determined by MALDI-TOF mass spectrometry. The density of each band was measured to determine changes in the relative concentration of each apolipoprotein in the HDL fraction. Data are means ± SEM. * (P < 0.05) denotes a significant difference compared to vehicle controls. # (P < 0.05) denotes a significant difference compared to LPS rats. N=5 for each treatment group. |