 |
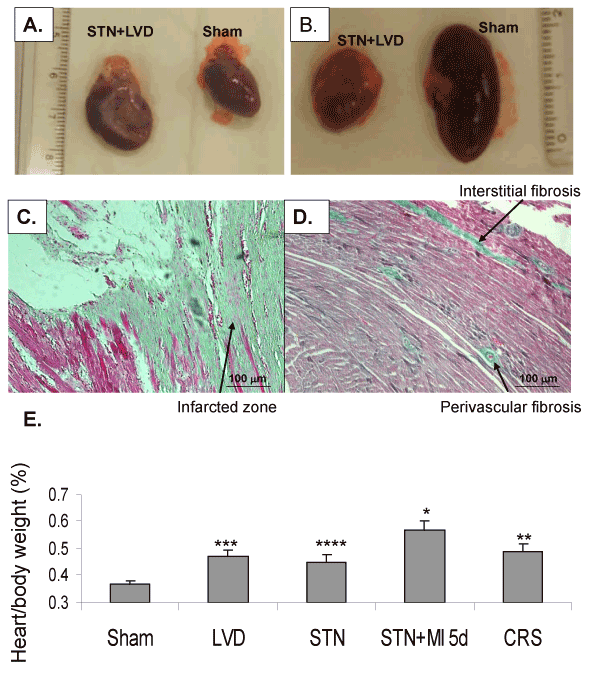
| Figure 2: Cardiac and renal remodeling in CRS upon termination. (A) A representative overview of an infracted heart in CRS (STN+MI) versus shamoperated heart; (B) The remaining left kidney stump in a representative CRS animal versus normal (sham-operated) kidney. All animals were terminated 8 weeks post STN (4 weeks post MI induction). A histological analysis using Masson’s trichrome is shown for LV sections upon MI (C) or STN (D). The graph in panel E shows the ratios of heart weight to body weight (in percentage). CHF stands for MI 4 weeks. (*) p (STN+MI) < 0.008 compared to sham, STN and CHF (no statistical significance compared to CRS, p=0.24). (**) p (CRS)=0.014 compared to sham a (no significance compared to the other groups, p>0.2). (***) p (CHF)= 0.056 compared to sham and (****) p (STN) compared to sham= 0.139, showing a trend towards statistical significance (one way ANOVA). |