 |
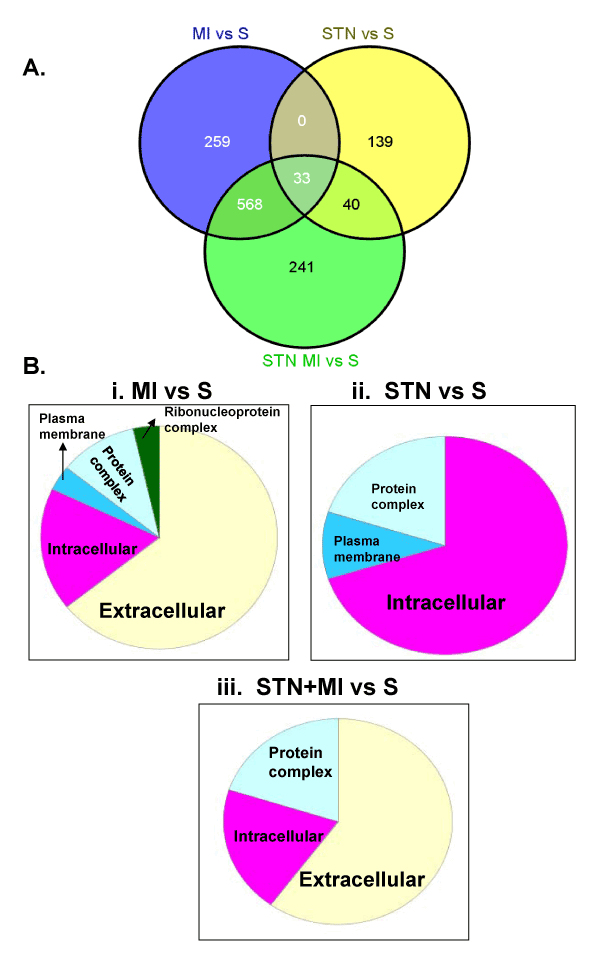
| Figure 3: An overview on the cardiac genes whose expression is modified upon STN, acute MI or STN+MI (all compared to sham). (A) Venn diagram which includes differentially expressed genes upon STN, MI or STN+MI compared to sham (fold change >+1.5 or <-1.5 and p<0.05) (B) Pie charts representing the enriched cellular components of the modified genes (i. MI vs Sham; ii. STN vs Sham; iii. STN+MI vs Sham) according to Panther database (http://www.pantherdb.org/). |