 |
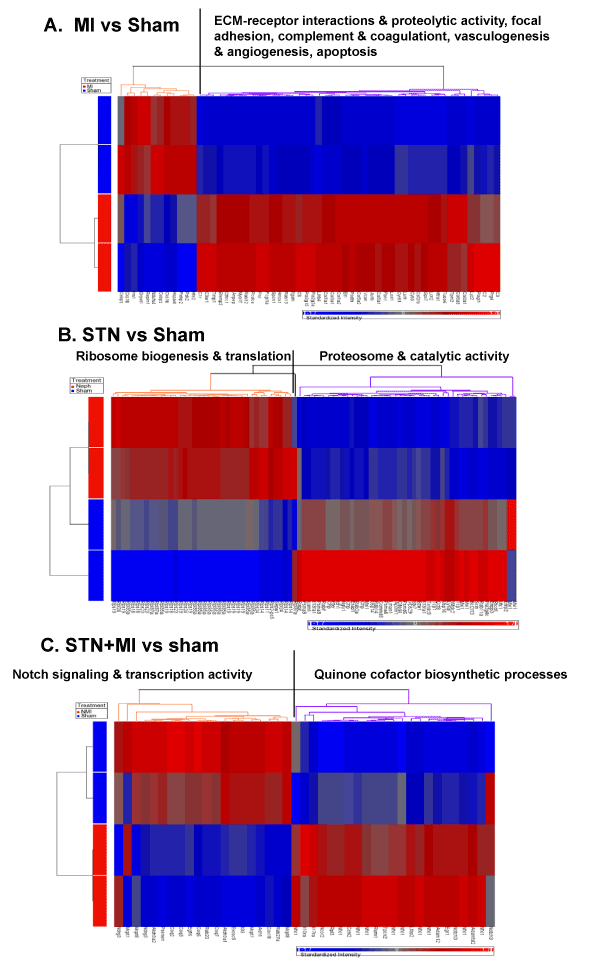
| Figure 4: Functional annotations of clustered differentially expressed genes. An enriched functional annotation analysis of differentially expressed genes upon (A) MI, (B) STN, (C) STN+MI, each compared to sham, was obtained using the David software (http://david.abcc.ncifcrf.gov/tools.jsp). Hierarchical clustering show upregulated (red) or downregulated (blue) gene expression of the various treatments relative to sham. |