 |
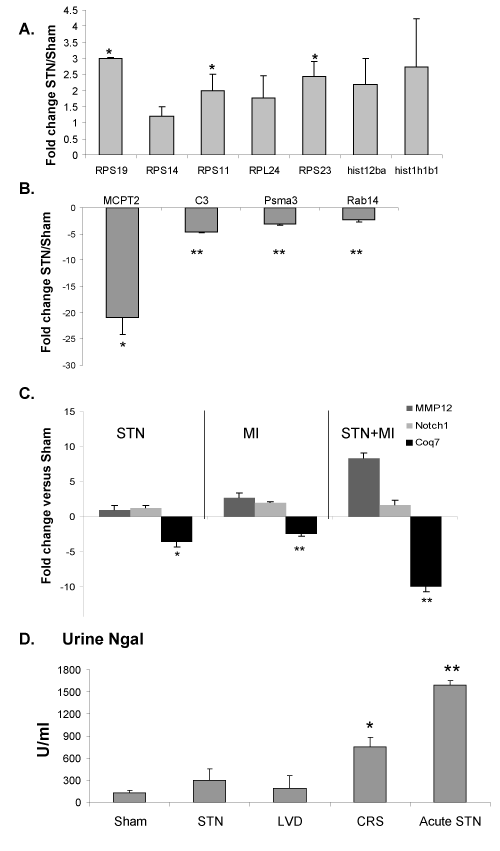
| Figure 5: Real-time analysis. Validation analysis of several of the major interesting genes whose expression was modified in the gene chip array analysis compared to sham-operated controls (A) upregulated genes in STN versus sham-real time PCR (*) p<0.05 compared to sham; (B) downregulated genes in STN versus sham (real-time PCR) (*) p=0.01, (**) 0.05 <p <0.01; (C) genes modified in STN+MI compared to sham (real-time PCR) (*) p< 0.01 compared to sham, (**) p< 0.001 compared to sham; (D) Urine Ngal levels upon the acute and chronic insults (ELISA). (*) p<0.01 compared to sham, STN and LVD; (**) p<0.01 relative to sham, STN, LVD and CRS. The differences between readouts in panels A-C were tested by two-tailed student’s t-test. The differences in the data depicted in panel D were analyzed by one-way ANOVA. |