 |
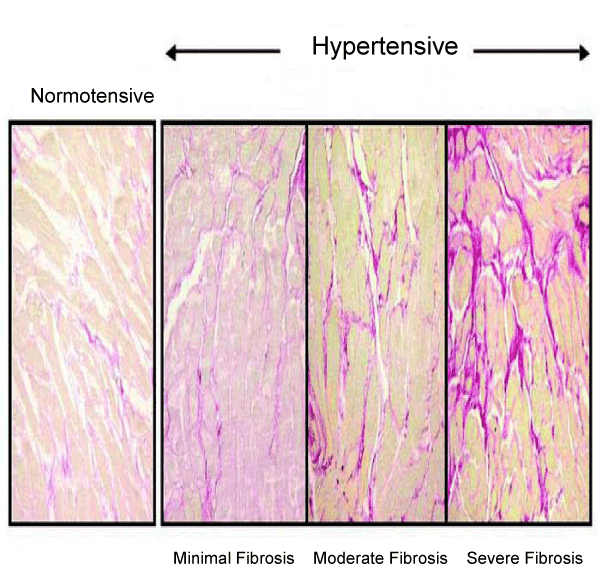
| Figure 3: Collagen content in the hearts of a normotensive patient and 3 patients with hypertensive heart disease. Patients are classified according to the degree of myocardial fibrosis: minimum (left), moderate (center), and severe (right). Sections are stained with picrosirius red and collagen fibers appear red. Reproduced with permission from Diez et al. |