 |
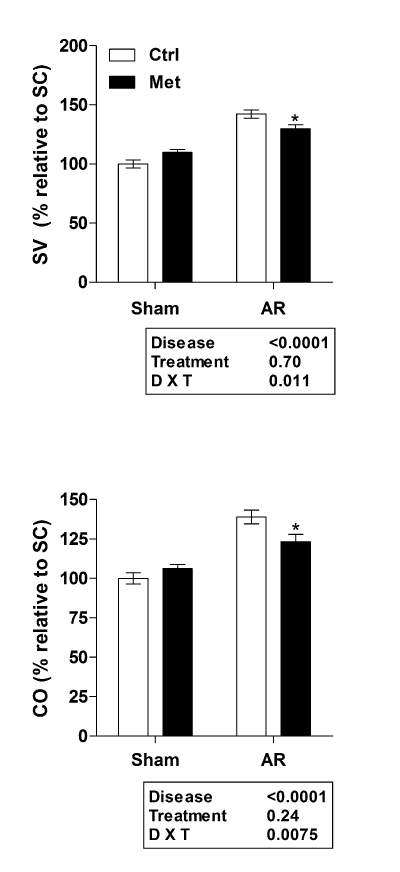
| Figure 3: Metformin treatment effects on stroke volume and cardiac output as evaluated by echocardiography. Results are reported in % of change relative to the untreated control sham group (SC) as mean ± SEM (n = 13–15/group). Two-way ANOVA statistical analysis results are displayed below each graph. D X T: disease and metformin treatment interaction *: p<0.05 vs. untreated corresponding group from Bonferroni post-test if P<0.05 for D x T. |