 |
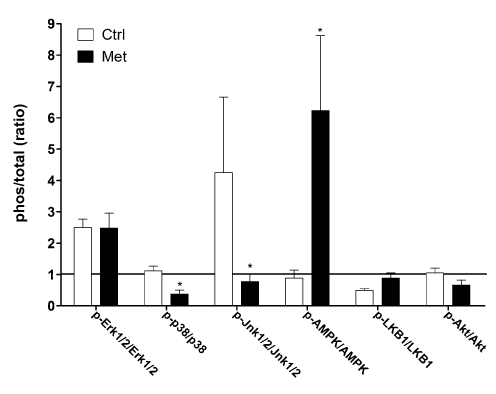
| Figure 8: MAP kinases, LKB1, AMP kinase and Akt levels of activation in AR rats treated or not with metformin. Evaluation of the phosphorylated and the total protein contents for each signaling molecules were performed by immunoblotting as described in the Materials and methods section. Results are reported in arbitrary units as mean ± SEM (n=10–12/group) of the ratio of the phosphorylated content on the total protein content. Untreated sham (sham-operated animals; SC) group protein contents were normalized to 1 and are represented by the black lane. *: p<0.05 vs. ARC group. |