|
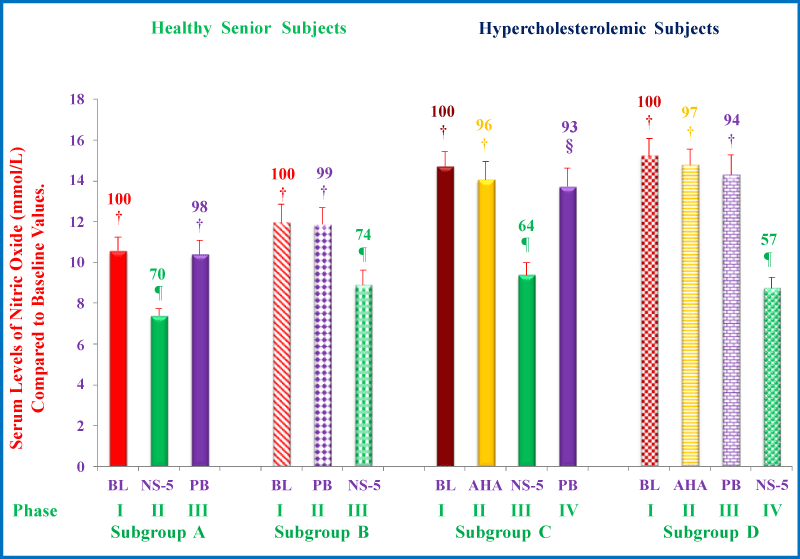
| Figures 2: Serum levels nitric oxide (NO) are decreased with NS-5 consumption. The treatments 1 – 14 columns in the figure correspond to: Group A, n = 16; 1 = BL (Baseline); 2 = NS-5 capsule (Nutrition Supplement-5); 3 = PB capsule (Placebo-starch); Group B, n = 16; 4 = BL; 5 = PB capsule; 6 = NS-5 capsule; Group C, n = 32; 7 = BL; 8 = AHA ( American Heart Association Step-1 diet); 9 = AHA + NS-5 capsule; 10 = AHA + PB capsule; Group D, n = 32; 11 = BL; 12 = AHA; 13 = AHA + PB capsule; 14 = AHA + NS-5 capsule. The baseline serum NO levels of free-living healthy seniors of subgroups A and B were established during phase I. Subjects were then randomized to receive NS-5 capsule (subgroup A) or placebo capsule (subgroup B) for 6 weeks (Phase II). After a 2 week washout (no treatment), the subgroups were crossed over so that subgroups A and B received placebo capsule and NS-5 capsule, respectively, for 6 weeks (phase III). Similarly, the baseline serum NO levels of hypercholesterolemic subjects of subgroups C and D were established during phase I. All the subjects of (C,D) were then placed on an AHA Step-1 diet for 4-weeks, and NO levels measured again after 4 weeks (Phase II). They were then randomized to receive NS-5 capsule (subgroup C) or placebo capsule (subgroup D) for 6 weeks (Phase III). After a 2 week washout, the subgroups were crossed over so that subgroups C and D received placebo capsule and NS-5 capsule, respectively, for 6 weeks (Phase IV). The subjects of subgroup C and D were remained on the AHA Step-1 diet during phases III and IV and during the washout. The experimental details for Figures 3 to 9 were exactly same as described above. Data are means ± SE. Values in a column not sharing a common symbol are significantly different of various groups at A-¶ P < 0.02, B-¶ P < 0.02, C-¶ P < 0.02, D-¶ P < 0.01. Percentages of each treatment compared to baseline values are above the column. |