|
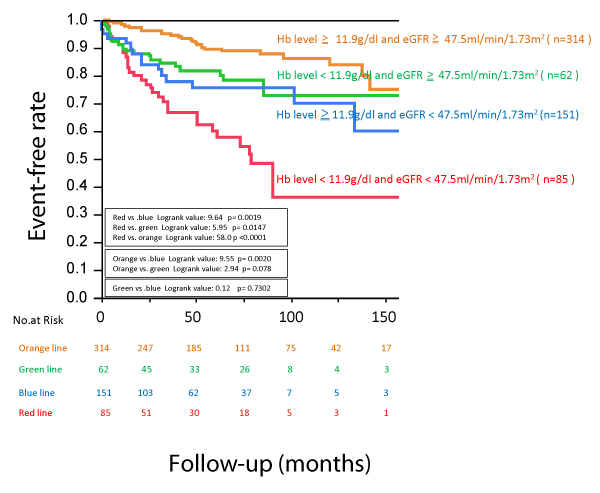
| Figure 3: Kaplan-Meier event-free curves of three subgroups classified by both cutoff values of Hb level and eGFR after adjustment using New York Heart Association functional class, dyslipidemia, drug use, and BNP concentration. There were significant differences in survival rates among the four subgroup: the subgroup that had both Hb level less than 11.9 g/dL and eGFR less than 47.5 ml/min/1.73 m2 (in red) had a lower survival rate than those in the other subgroups (in green and blue and orange). |