 |
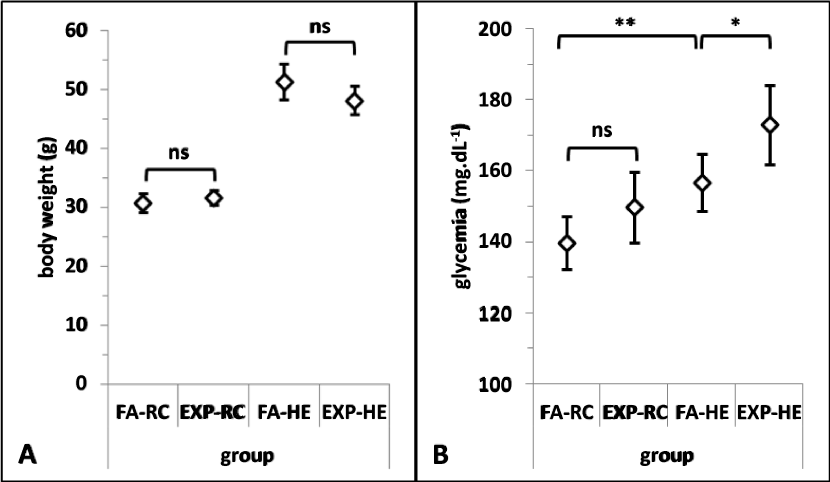
| Figure 1: (A) Body weight as Y axis and animals group as X axis represented as FA-RC (filtered air - regular chow), EXP-RC (exposure concentrate air containing PM2.5- regular chow), FA-HF (filtered air - high-fat diet), EXP-HF (exposure concentrate air containing PM2.5- high-fat diet). (B) Fasting glycemia measures as Y axis and animals group as X axis. The points represent the mean and bars represent the 95% confidence interval of the mean. ns (not significant), * (p <0.05). |