 |
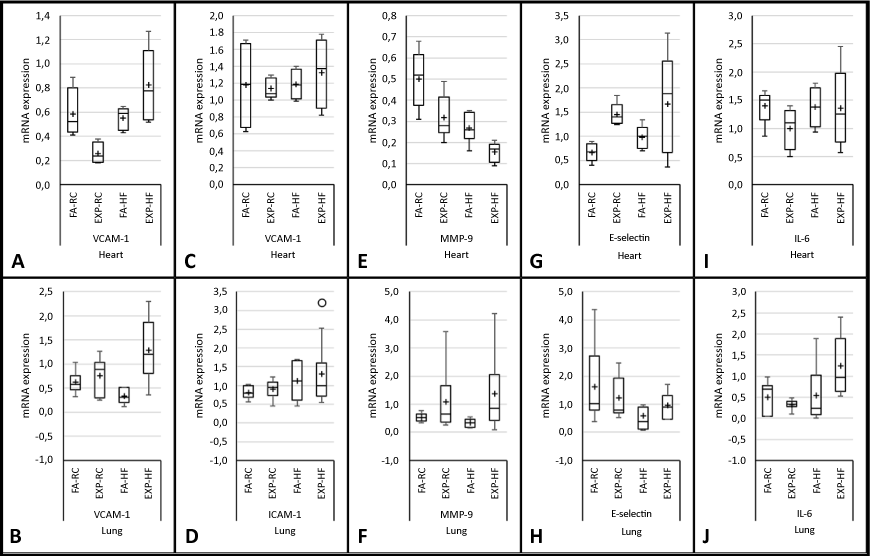
| Figure 2: Gene expression results plotted as boxplot. mRNA expression results are in Y axis and samples heart and lung of the animals group amplified to VCAM-1, ICAM-1, MMP-9, E-selectin, and IL-6 genes in X axis represented as FA-RC (filtered air - regular chow), EXP-RC (exposure concentrate air containing PM2.5- regular chow), FA-HF (filtered air - high-fat diet), EXP-HF (exposure concentrate air containing PM2.5- high-fat diet). The cross represents the mean value of each data set. The circle represents an outlier value. |