 |
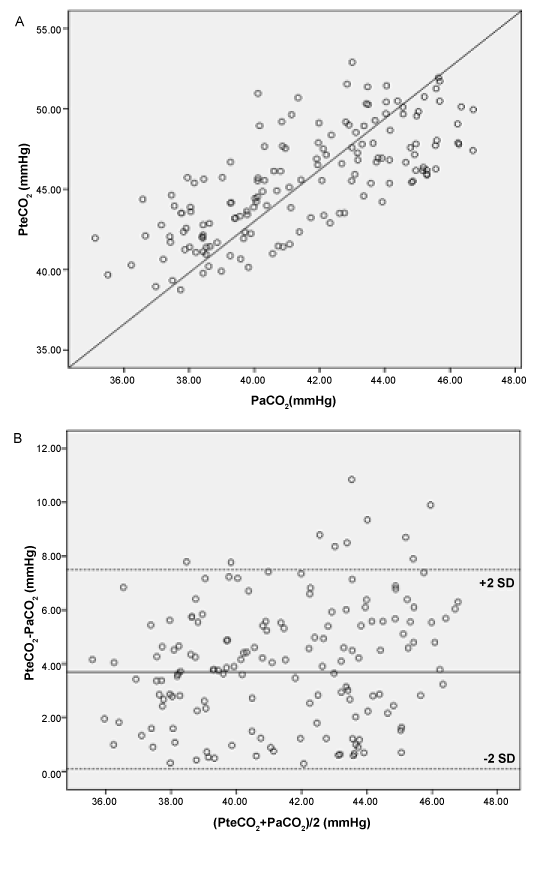
| Figure 1: (A) Correlation between PaCO2 and PtcCO2 shows a coefficient r=0.73. Regression analysis: PaCO2=0.63×PtcCO2+ 12.89, r=0.73, p<0.01. (B) Bias and LOA between PaCO2 and simultaneously measured PtcCO2 measurements. The solid line represents the mean of the differences (= bias) between PaCO2 and PtcCO2 (3.8±1.85 mmHg). The dashed lines are equivalent to 2SDs of the means (= LOA). |