|
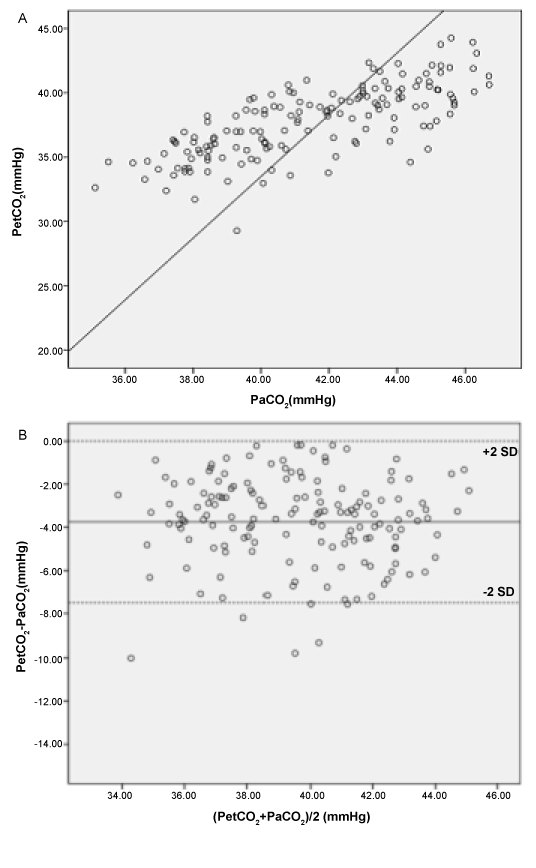
| Figure 2: (A) Correlation between PaCO2 and PetCO2 shows a coefficient R2=0.84. Regression analysis: PaCO2 =0.51 × PetCO2+19.35. (B) Bias and LOA between PaCO2 and simultaneously measured PetCO2 measurements. The solid line represents the mean of the differences (= bias) between PaCO2 and PetCO2 (–3.9 mmHg). The dashed lines are equivalent to 2SDs of the means (= LOA). |